The UCOVI Blog
The UCOVI Blog
The Swiss Army Knife of Data – slice wasted time in half with these 10 small tricks for working with data
Ned Stratton: 9th September 2021
The paradigmatic data professional has the full skills package of coding, statistics, innate design sense, resourcefulness and problem solving, as well as the 'people' skillset of communication, patience and tact needed to impress findings on business users.
But what passes under the radar is low-level IT wizardry and time-saving shortcuts, particularly when things aren't well automated. Whether you're a BI analyst, a data scientist or the head of an analytics team, all or some of the below will eat up your working day:
- Searching for an email someone sent six months ago.
- Hunting for files in your company's myriad of network drives and folders.
- Making spreadsheets, and cleaning spreadsheets you've been sent.
- Finding and removing the trailing spaces in the ID column to make your VLOOKUP work.
- Weekly, daily or monthly regular reports that involve downloading the same data or executing the same SQL query but with a few different WHERE clauses.
- Formatting reports into the house style of your company or client.
For this, allow me to present The Swiss Army Knife of Data - a hand-held toolkit of random Windows, Microsoft Office, and miscellaneous general purpose computing need to knows and "I never thought of Python for doing that" tricks that as a data analyst, I couldn't survive without. They will cut hours of faff from your working week and give you the satisfying glow of tech-ninja status.

Imagine you're looking for something specific in your sales data, and you start with a simple SELECT * FROM statement. This returns 2.4 million rows in the result window – no good. So you want to refine it to just the June 2020 data to reduce row count and pick a likely date range for what you were searching for. So you refine it to SELECT * FROM Sales WHERE YEAR(SaleDate) = 2020 AND MONTH(SaleDate) = 6: now you get 57,000 rows, which is easier to work with and shows you the particular product category name you were interested in – 'Red Gloves'. So you refine it further to include Red Gloves sales in US dollars with SELECT * FROM Sales WHERE YEAR(SaleDate) = 2020 AND MONTH(SaleDate) = 6 AND SaleProduct = 'Red Gloves' AND Currency= 'USD'.
Now for the annoying part. You just wanted Red Gloves sold in dollars, regardless of the date range, which you only used for starters to filter the data down to the most likely time frame for that product and currency. But you can't simply comment it out in your query, because it's on the WHERE line and a syntax error will be thrown without it. So you have to comment the whole line out, then replace AND with WHERE on the line with the SaleProduct filter. You then have to do this in reverse if you want to re-use the date filter in your query to get the data for 'Green Socks' in Euros.
Instead, what you should have done is start your opening query with WHERE 1=1 as a filter clause that will always evaluate to be true. That way, your real filter clauses will all be after AND operators, which can be commented and uncommented with far fewer keystrokes.

Every company uses Excel for at least some of their data storage and reporting, even if they deny it or say they are implementing something better. If you use spreadsheets a lot, you'll benefit from VBA. Whether you've coded it up from scratch or pinched it from Stack Overflow, saving your VBA scripts in the right place is as easy to forget as it is to learn. So knowing the full Add-In saving and loading process makes the top ten. Do as follows:
- Save your active worksheet with VBA modules in it anywhere you like as an Excel Add-in (.xlam) file.
- Copy and paste to C:\Users\username\AppData\Roaming\Microsoft\AddIns. (Customise the username bit with the login username of you or the colleague you’re giving the xlam file to.)
- Go back to Excel, go to Developer tab (File>Options>Customize Ribbon to activate this tab if hidden), and click on the Excel Add-ins icon, where you can then see the name of your xlam file in the list of add-ins available to select. You now have all your Macros available in one place to use, maintain and add to.
Honestly, I've Googled the C drive link in step 2 so often that I wish I had it tattooed on my left arm.
Staying on Excel, here comes a technique for entering the same thing in multiple cells so powerful it made someone cry with joy, according to an Excel VBA tutor I met a few years ago.
Suppose you have one column that's mostly but not completely empty and you want to fill the blank cells with 0. The numpty approach is to filter on the column to select only blanks, put 0 in the top filtered row, and drag down to copy. That'll take a patience-testing amount of time left-click holding the mouse if you have 40,000 rows.
The Swiss Army approach is not to filter and drag down, but to select the whole column from row 2 to the end of your data range, then look for Go To Special... in the Find & Select options next to where the filter button is. This gives you the option to select all the blank rows in your original whole-column selection. You then type 0 to populate the first cell of your selection, and instead of hitting the return or Enter key, press Control + Enter, and all cells in your selection – which will only be the blank ones – will be populated with 0.
Neatly explained here.
You've spent a solid few hours poring through the internet for articles on unexpected error messages or approaches to looping iteration in SQL, checking Slack messenger notifications as well. As a result, you have an eye-watering 26 open tabs in Chrome. So you close some of the older ones. But you accidentally close one you wanted to keep open. Nay bother. The keyboard shortcut Control + Shift + T will reopen the last tab you closed, and the one before that if repeated, and so on.
This is the Excel keyboard shortcut in Windows for adding and removing the filters. Much lesser known than Ctrl + C/V for Copy/Paste and Ctrl + S for Save, but just as effective as a time saver and cure for RSI. It comes especially in handy with a 30-column spreadsheet with filters already applied; Ctrl + Shift + L removes all filters as well as disabling the filter icons so that you don't have to scroll from left to right looking for which columns are the ones filtered.
Another Excel keyboard shortcut – this time for adding today's date as a value in a cell. Inexplicably overlooked when one considers how may spreadsheet operations require today's date, such as filling a column of "Date Imported" timestamps to prepare CSV data for your CRM, or populating a tracker with task created or completed dates.
An absolute must for cleaning data from a source system for analysis or preparing data to load to a CRM.
In the first case, source systems (think backend data from a Wordpress website or another buggy database software) sometimes store whole-number values as text. This means that when you download extracts as csv or xlsx and open them up in Excel, you get the annoying green arrow in each value's cell telling you that they're formatted as text. Correcting this in the format options from the Home tab is harder than you think, so converting them to numbers by calling =VALUE(B2) where B2 is your data value bails you out like the shady guy with a suitcase full of banknotes at your pre-trial court hearing. With your ID numbers now numeric, your VLOOKUP will work.
In the second case, you might be preparing some dirty user-form data for upload to the main CRM. The standard snag here is when there's no validation or standard formatting on the mobile number column, catching you out when a few of them don't have spaces and erroneously format as scientific numbers when you save as csv pre-import. The VALUE function throws an error when called on a value containing non-numeric characters, so you can use it as a check for any mobile numbers that don't error, and therefore need formatting with a space or "Mob:" prefix to prevent rogue scientific formatting.
Another persistent issue with other people's spreadsheets is leading and training spaces and other delights such as bullet points that stop your IDs from matching or get in the way of clean copy and paste. Except...they're not spaces (as you discover when your find and replace doesn't get anything), they're actually carriage returns, tabs or non-breaking spaces. You can scrub these from your values using =SUBSTITUTE(B2,CHAR(160),"") to get rid of non-breaking spaces, CHAR(9) to get rid of tabs, or CHAR(149) for bullet points. This also applies to SQL, which has CHAR to support its REPLACE function, but be warned that the codes for SQL are ASCII character codes instead of ANSI, and therefore slightly different, though tabs (9) and line breaks (10) are the same for both.
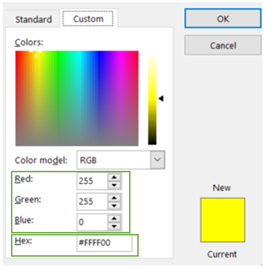
You're putting together the end-of-quarter financial reporting pack in Excel/Power Point and you can't find the company-branding-complaint tone of Magenta in the colour palette that absolutely must be used for the data labels.
As Matt Damon said in The Martian, hexadecimals to the rescue!
Screenshot the tone of Magenta you need, load the image into a free colour picker, and make a note of the RGB code (a set of 3 numbers from 0 to 255) or the hex code (a # followed by six numbers or letters). You can then input this into the custom colour palette in Excel, Power BI or Tableau to get the colour you need.
But why stop there? Hex colour codes can be used as columns in Power BI data models to achieve dynamic chart formatting on custom visuals, while RGB codes are the trick to VBA routines to automate chart creation and complex conditional formatting in Excel, or customising the colours used in Python's matplotlib visualisation library. Definitely worth a corkscrew-sized berth on the Swiss Army Knife of Data.
Of all the Swiss Army knife tricks, this one is my favourite and makes learning Python worth doing even if you don't make it as a data scientist.
Situation: You need to dig out an email someone sent you about sales leads funnel reporting requirements, and find a PowerPoint presentation from the J drive. You think the email was sent from Steve in marketing (ginger hair, but you can't remember his surname and he left last week) within the last month, and the PowerPoint is called "Lead Flow process".
Problem: You're not one for assiduously filing emails in your inbox, and you know the J drive is a sprawling mess. To top this, the searching capabilities of both Windows File Explorer and Microsoft Outlook are slow, restrictive and hit-and-miss. You could be here all day.
Solution: Use Python for both. To search for files in a network drive, the os library enables you to read the full filepaths, created dates, even size in bytes of all files on a computer drive into a list of text strings, with which you can then use the ore library to strategically interrogate one-by-one for relevant name contents and file extensions using regex expressions. See my GitHub where I accomplished this in less than 50 lines of heavily-commented code, runnable in a Jupyter Notebook or command window.
For the emails, you can connect to your own Outlook account with the win32com.client library and then use re and datetime to interrogate each email's subject line, body text and date received to pinpoint the elusive sales leads email from Steve. (This article gives the best step-by-step on how to do this.)
In truth, the Swiss Army knife of small but sneaky computer hacks for data could have enough tweezer-sized gadgets on it to fill an aisle in B&Q: Data tables in Excel, API querying with Python's requests library, and Windows Task scheduler jobs to set repetitive tasks running just by turning on your laptop all just missed out on the top 10. I'm sure readers of this will have their own exotic hacks that I’ve not considered – email them to blog@ucovi-data.com and I'll consider doing a Part II.
The crucial take-away is this: none of the this is taught on data analytics bootcamps – you find it out yourself by taking 3 hours of your day trying to automate something that only took 20 minutes in the first place, hoping nobody notices. But the acquired habit for resourcefulness is what makes a data analyst, and if you can't be innovative with the small things, you can't begin to tackle the meatier data projects going around.
⌚ Back to Latest Post