The UCOVI Blog
The UCOVI Blog
Event Review: Big Data LDN 2021
Ned Stratton: 27th September 2021
The UCOVI Verdict: A satisfying reminder of the pre-COVID old normal, and a bazaar of pithy acronyms and hubristic buzzwordery which perfectly encapsulated why people and businesses are boxing blindfolded when it comes to data
Back to normal
September is notoriously busy for the events industry, and Big Data LDN which ran last week from Wednesday 22nd to Thursday 23rd at Kensington Olympia, London had a well-attended, back-to-business feel to it.
An enthusiastic delegation, a packed agenda of talks and seminars from high-profile companies (Trainline, Sega, the dating app Bumble), and a race to the top in terms of exhibition stand perks (free coffee with dedicated baristas, foosball tables, £20 takeaway delivery vouchers), all gave the impression of a sector in resurgent mood after an 18-month pandemic battering, as well as hope that the face-to-face element of life and business has not lost its importance.
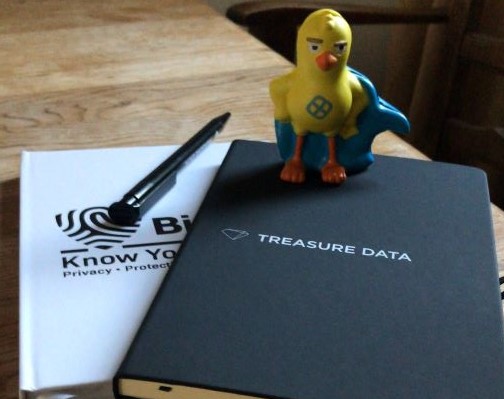
For sure, the spectre of Coronavirus lurked about somewhat; proof of vaccination or a negative test was an entry condition, exhibitors were giving away branded face masks as freebies. Staff on loudspeaker even asked delegates to put their rubbish in bins "because of COVID", as if it required a global pandemic to prevent them from dropping sandwich crusts and sweet wrappers on the floor like toddlers. But mostly the atmosphere was energetic - people were keen to exchange data stories and fist bumps. When I attended on Wednesday I picked up a haul of two notebooks, a stress ball and six pamphlets, and had my delegate badge scanned by nearly 15 exhibitors. Perhaps I'm too relaxed in the calm before the spam-storm to come.
For sale: Data integration gadgets with GUIs
Always crucial to bear in mind is the principal driver of the events industry – sales. An event has two main happenings, which are firstly a marketplace of exhibitions stands, paid for by companies to showcase their products and talk to potential buyers (the delegates), and secondly mini theatres dotted around the venue where speakers give talks to the delegates on subjects related to the theme of the event. The latter is no less of a sales pitch. The person or panel of people giving the talk does so to present the company they represent as an innovator in the field worth working with and/or buying from.
This applies to Big Data LDN as it does to The National Wedding Show, Blockchain Expo Global and any big tradeshow under the sun, and it's why exhibitor stands and the mini theatres scan delegate badge barcodes. They are linked up to the delegates' registration data and contact details; red-hot leads for company marketing databases.
As a delegate, you can either freak out over how may people have your email address and plead GDPR and the right to be forgotten, or accept inbox-filling marketing emails as a price worth paying for refreshing your knowledge of what's current in your chosen industry next to like-minded, useful-to-network-with people at an event that is free to attend. I'm of the latter temperament, but it's each to their own on this divisive subject, something which motivated me to run the Political Spectrum of Data survey in 2020 (still open).
Most of the products on display at the exhibition stands of Big Data LDN were software tools that data analysts could use to connect to primary data assets, then blend them together in virtual data streams and see if anything interesting washed up. Some of these tools are geared towards data science, others towards analytics or data governance, but they are essentially the same thing: a web interface that shows databases, their data and transformations to it as a daisy-chain of arrowed lines linking colour-coded nodes. Alteryx is the market leader here, but vying for their place at Big Data LDN were Dataiku, Treasure Data and my personal favourite – Omniscope by Visokio, which stood out by dent of having its own integrated visualisation suite.
The dominance of a product like this reflects the state of data in so many big companies - a sprawling, heavily-silo'ed hodge-podge of mutually-duplicating datasets stored on a multitude of different platforms in a way that takes account of every consideration bar one – how to effectively analyse the data. Rather than helping companies thrash out a workable data strategy which consolidates technologies and databases down to a manageable stack, the supply market indulges the chaos. It does so through a contest to put out the CDP platform/integration tool/whatever you call it that has the most number of database connectors, can automate their integration the quickest, and can even run a K-Nearest-Neighbour clustering algorithm on the 67 sources of primary data at the click of a button for good measure.
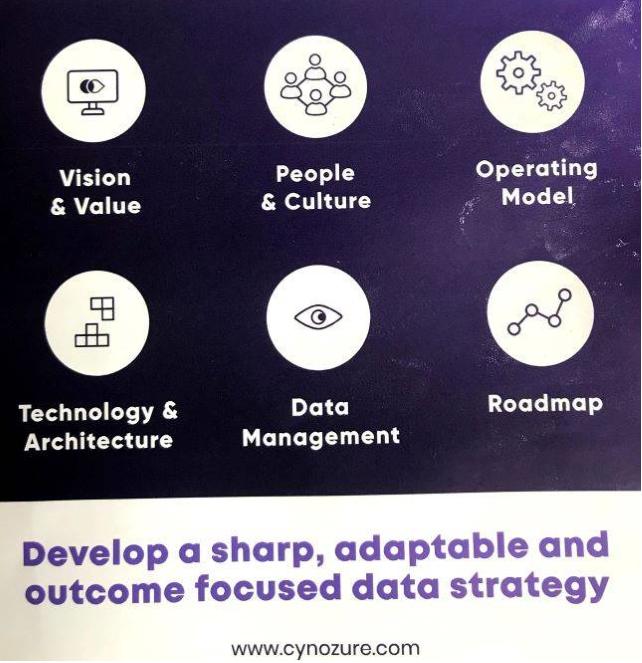
A lone buoy in the choppy harbour of gadgetry was Cynozure, a consultancy company supporting companies to improve their data strategy by evaluating internal culture and processes. Their on-site offering was a survey for delegates on how they viewed data at their own companies, resulting in a percentage score for how well the company was performing on data strategy. The Cynozure strategy-development method was based on six facets supposed to influence business data management – including Vision & Value and Technology & Architecture – and was far too much like UCOVI for my liking. I left feeling deflated about how I suddenly had competition that had their own 3D barcode. Ouch.
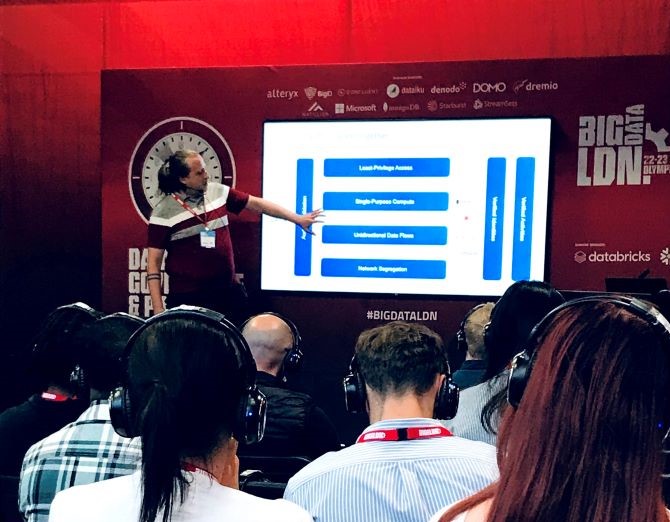


The speaker for NHS Digital attempts camouflage with the theatre to avoid recognition.
The best in class of ubiquitous data integration daisy chains from Visokio
Buzzword-driven insights from slogans in real-time
Hopefully sub-second won't become sub-standard
Six-stage data management theory from Cynozure
Putting WH Smith out of business with free stationery
Get yer COAT, you've pulled - the enigmatic Classification Guru Susan Walsh
Tough on slogans, tough on the causes of slogans
Buzzwords around the complexity and transformative potential of data were at their glorious best at Big Data LDN; adorning stand displays like Fleur De Lys wallpaper at a stately home and spewing out of people's mouths like dad jokes at a wedding. Talk around data science being the sexiest job of [insert year here] and how everything is moving to the cloud (a huge misnomer since the cloud is essentially mega-servers buried deep underground in Texan data centres) still persists, but the visual and verbal variety of buzzwords on show was more around speed and simplicity than complexity. "Low-code" and "real time" were both doing the rounds, a stand manager I spoke to claimed his database product transformed data from "event to insight in milliseconds", and "Sub-Second Analytics" was the slogan for Firebolt's Data Warehouse solution. (Risky in my opinion – a few dissatisfied clients would be all it takes to get the nickname "Sub-Standard Analytics").
The Star of The Show
The hubris of the exhibition floor spread into the theatres somewhat, with speakers in the sessions I attended elucidating about the tribulations of processing big data and how they had it down to a T. Two cool-dude data scientists from Bumble proudly presented their work with DBSCAN and Complex Hull algorithms to explore how many people would use their app in different continents. In the Privacy and Governance theatre, the Head of Software and IT at NHS Digital's Data division revealed the killer flow diagram of big servers and cutting-edge tech that proved how NHS Digital could be trusted with our health records. His presentation was three minutes for a half-hour session and he was keen to wrap up the 27-minute Q & A in under five minutes, so I simply couldn't resist asking him why his flow diagram didn't have Microsoft Excel in it as the container for Test and Trace data, which brought about mild sniggering and an evasive answer.
But it was a talk about Microsoft Excel – from Susan Walsh, the self-declared Classification Guru - that was the star turn. She had the obligatory PowerPoint morph animations and invented acronym ("Does your data have its COAT on?" – with COAT standing for Consistent, Organised, Accurate, Trustworthy), but in a crowded field of big data lakes, real-time analytics in the cloud and other such solutions of high technical complexity, here she was giving a talk on cleaning data using Excel VLOOKUP and pivot tables! It was real back-to-basics stuff, explaining to delegates the importance of checking for spelling variations of the same company before reporting on who their biggest customers were. Was Susan having everyone on?!
Evidently not, as her book Between The Spreadsheets: Classifying and Fixing Dirty Data (RRP £36) came out this week to coincide with her talk. She clearly sees a market for it, and so did the Big Data LDN delegates. Her talk was standing room only and easily the best attended - very impressive work for the 1:30 lunchtime slot.
Susan Walsh's success summed up what Big Data LDN shows about the state of the data world – we're trying to algorithmically micro-segment our customers and project the results onto a cloud-hosted 3D geo heatmap visual before we've even checked if they are in Victoria, Australia or Victoria, SW1.
⌚ Back to Latest Post