The UCOVI Blog
The UCOVI Blog
The Power BI End Game: Part 1 – From Data Analyst to Insight Explorer
Ned Stratton: 14th August 2020
Microsoft Power BI has taken just five years from its launch in 2015 to becoming the world's premier analytics and BI tool, as rated by the Gartner 2020 Magic Quadrant. This is some achievement considering the longevity of its competitors: – Tableau (founded 2003), QlikView (1993), and Looker (2012). In this time, it has evolved frenetically both in functionality and scope. Power BI started life as a visualisation tool to create reports and dashboards from common data sources. Now it spans app development, ETL and database admin, even data science and AI.
Clearly Microsoft's aim is more than just engaging dashboards with timeline slicers and maps. In the first of a series of three blog posts, I'll be discussing aim #1 in Microsoft's trio of strategic objectives with Power BI – replacing Data Analysts with Insight Explorers.
A Power BI Dashboard about the History of Power BI
The development of Power BI Desktop as a product has been so constant over the past 5 years that a new version of it has been released pretty much every month. Microsoft documents the new features included in each new release in its updates archive.
It categorises the updates as follows:
- Visuals/Reporting - new charts, formatting options etc
- Data connectivity - new connectors to data source types, eg Dynamics, MySQL, Salesforce
- Analytics – new analytics capability within Power BI models and visuals, eg. Q&A, Explain this increase, key influencers, distribution insights, filtering options on reports
- Modelling - mainly new DAX functions and new features within the relationships view of Power BI
- Query Editor – updates and new functionality within Power Query and the M language
- Other - mainly admin improvements, such as security, exporting data, and general speed improvements
The categories have changed names a bit and been used differently over the years (new DAX occasionally lands in Analytics), but on the whole it has been consistent and is a useful framework within which to study the functionality areas that make up Power BI, and the level of attention that each area has received.
This potted history of Power BI's evolution bears comparison to the ideas forum, which now has 20,000 independent development suggestions for new functionality from users. This isn't categorised like the release updates archive, but embracing the emptiness of my COVID-19 lockdown social calendar, I web-scraped categorised the 700 ideas on the forum with over 100 votes into the same groups as the updates, and got to work on the below dashboard.
Readers can peruse over its tabs at leisure, but the main headlines from the dashboard are that report design functionality and new visuals account for most of the updates and suggestions, and the proportions of work done in each category broadly matches the user ideas, with two notable exceptions.
Firstly, the admin functionality of exporting data and managing speed and security that fell into the Other category in the release updates archive is so well-represented in the ideas that it is second place as its own category. Second, Analytics as a category – Q & A, Explain this Increase, Personalise Visuals – has received far more development time than the demand for it among the user base merits. 10% of the updates over the past 5 years have been for self-service analytics, but only 2.5% of the ideas.
So if Power BI's users have said over 20,000 times that they mostly want an easier life visualising data, why are the Power BI dev team taking time away from the backlog of improvements in this area to build self-service analytics?
Arise, Sir Explorer of Insights
The answer to this question can be found in this revealing talk given to a meetup group for Power BI Users in London almost exactly a year ago by Microsoft. There are two facets to it. Firstly, the classic tendency in software development to favour new innovations over bug fixes. 59 minutes in, an audience member asks "Amidst the innovation, can you also take stock of your product and consolidate some of the features so that there’s more compatibility between the visuals?" The response is supportive, but along the lines of "a law of diminishing returns", saying that small fixes to make visuals easier to work with are too labour intensive to prioritise.
The second element to the answer is more deliberate and radical. The main thrust of the talk (14 minutes into the video) is about how the Power BI team plan their development schedule around the needs of five fictional user "personas", all conceived around their job role and level of interaction with Power BI. They are given names, job titles, and pull quotes describing their principal concern or emotion with Power BI. Here they are in full:
- Ash the analyst - "I spend way too much time formatting reports for my end users"
- Nat the business user - "What is the difference between a report, dashboard, and app? Why should I care?"
- Vic the insight explorer – "I want to easily tweak the report, changing the time frame or other attributes"
- Binh the BI developer - "I spend way too much time formatting reports for my end users"
- Adi the admin - "I keep the lights on"
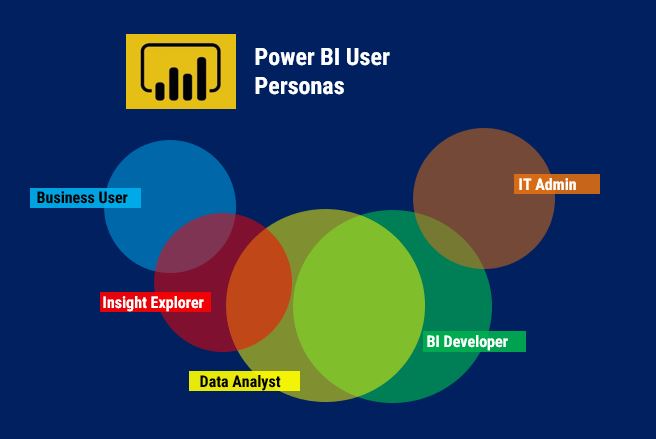
I've added the Venn diagram to show the crossover between the 5 roles described in relation to Power BI, with the size of the circles representing how important Power BI is to each job. There"s a noticeably huge crossover between data analysts and BI developers, both ubiquitous job roles nowadays.
For the purists, a BI developer is focussed on the technical tasks of preparing the data, building the model and putting together the DAX, and may be less of a designer. Whereas a data analyst – although still technical - is strictly speaking more geared towards using domain experience and visualisation principles to design and build reports. However, the reality for most businesses is that one person will do both jobs at once, and whether they are called data analyst or BI developer is the proverbial six of one, half a dozen of the other. So similar are they in fact, that Microsoft even provides exactly the same pull quote for Ash the analyst and Binh the BI developer (by design or accident we do not know).
The blending of data analyst and BI developer gets interesting when the "insight explorer" comes into the fold.
Watch the video from 16:30 minutes in for a full explanation, but in a nutshell an insight explorer is a business user who is data-savvy and computer literate enough to add their own formulae to an Excel report provided to them, or interpret and work with a Power BI dashboard in the service. They have crossover with the data analyst through their mutual sense for numbers/what makes a good report, and curiosity about what data can reveal.
Two's company, three's a crowd – and Microsoft believe that the data analyst will be crowded out by the BI engineer and the insight explorer. The Power BI analytics functionality they are prioritising – such Q&A (where you can type "how many bike sales in Germany in 2017" and a get a chart that tells you) and Personalise Visuals (switching the chart type or axis on visuals within the service) – lend themselves to the work of an insight explorer, who wouldn't build from scratch or write DAX measures, but would chop and change and add more to a report already built, feeding back the insights to a decision maker. Microsoft's parallel assumption is that the BI developer will seamlessly incorporate into their work the report design that an analyst would do, or that the reports and analysis of the future will be entirely self-service, with data professionals just being tasked with getting the underlying data structures in the right state to enable it.
Have Microsoft called this right? If they have, should we mourn the passing of the data analyst?
It's a bold gamble which puts a great deal of faith in the data literacy (and patience) of business users. I suspect that many of them self-identify as insight explorers by pouncing on mis-categorisations, pie charts which should be bar charts or and KPIs missing from reports, secretly thinking they could have done it themselves. But is it that easy? What if incremental improvements to an existing report are a world away from starting with a blank slide, and using it to translate complex data from multiple sources into something that makes sense to a business? This is the commercial-but-also-technical hybrid role that a true data analyst performs, the value of which Google's Chief Decision Scientist Cassie Kozyrkov explains in this article for Harvard Business Review.
Time will tell if Power BI insight explorers takes over from them, but data analysts shouldn’t need to worry about their job security. For one, they’re probably BI developers without knowing it. For another, the insight explorers will need them when they need to know what the "dimPromo_legacy" column contains.
⌚ Back to Latest Post