The UCOVI Blog
The UCOVI Blog

The Power BI End Game: Part 2 – Beyond SSAS/SSIS/SSRS
Ned Stratton: 28th August 2020
In the last post (part 1), I looked at the evolution and expansion of Microsoft Power BI from its beginnings in 2015 to present day, and how its Q & A, Personalise Visuals and other related self-service analytics extras point to the emerging Insight Explorer role within organisations.
But it isn't just self-service analytics that makes Power BI transcend the data visualisation tool it was conceived as. Power App visuals now enable a user to write data back to a source database from Power BI reports. Nearly 50 new DAX functions were introduced in July 2020 to boost tabular modelling capability in Power BI Desktop. Power Query functionality grows with each monthly update to the extent that coding with M is taking off as a sought-after skill. And finally, Dataflows takes ETL in Power BI one step further than Power Query by enabling data connections and transformations within the Power BI service that can serve any report or dashboard.
None of this serves a new need; data modelling, ETL and data-driven alerts on reports all existed before 2015 as did countless technology products for them...a lot of them built by Microsoft. Understanding this sets the backdrop for aim #2 of the Power BI end-game trilogy – replacing SSAS(Analysis Services), SSIS(Integration Services), and SSRS(Reporting Services).
Excel going nowhere
Before I read the last rites to the SSDT trio, I feel duty-bound in a piece on the future of Microsoft data products to mention Power BI's implications for Excel. Does the former represent the future of the latter? Short answer, no.
First, Excel still beats Power BI in its own backyard somewhat with pivot tables. Custom formatting of empty cells is easier, more table formats are provided, not to mention useful advanced tools for analysts such as creating custom groups/bins for row and column categories that can even be re-used for slicers. (My assessment of the Power BI team's development priorities from my previous post suggests this will not change soon.)
Second, Excel is hardly losing out to Power BI in receiving its fair share of TLC and new analytical and AI gadgets. By this I'm referring to the new dynamic array formulae and the Ideas tool that spits out charts and pivots from free-text questions, exactly like the Q & A in Power BI.
Power BI and Excel are not substitute goods.
The super-department of data
My hunch for Power BI squeezing out SSAS/SSIS/SSRS (letting Microsoft off the hook for investing in them beyond user support and bare minimum backward compatibility) is grounded in a combination of Google trends stats, and my own experience of using all of them. But first, a Peep Show reference.
In series 4 episode 2, Mark Corrigan (David Mitchell) is comically asked by his boss Johnson to be Camilla to his Prince Charles at the fictional firm JLB Credit if he succeeds at "Project Zeus": merging the sales and marketing departments into one. In an office brainstorming session (remember them before lockdown?), one of Mark's team suggests adding the Planning department to the merger as well, thereby creating a wide-ranging if somewhat nebulous "super-department".
Corrigan angrily dismisses the idea as fit for toilet paper, only to then come up with nothing better over course of the episode and plaintively beg his team member to present it for him at the last minute.
I can't help feeling that the Project Zeus Super-Department to JLB's Marketing, Sales and Planning depts is precisely what Power BI is to SSAS, SSIS and SSRS. It covers pretty much all functions across all three tools.
SSAS - A Power BI data model is a collection of tables mapped together by relationships between mutual columns, made report-ready by aggregations on fact columns expressed as measures written in DAX. This is the top and bottom of what an Analysis Services Tabular database is for.
SSIS – Power BI accomplishes much of what one would wish from an Integration Services package through Power Query for specific reports, or Data Flows to ingest disparate data sources and transform them into a common data model available to serve reports...which is essentially what a data warehouse boils down to.
You could argue (and many SQL DBAs would) that as it stands, Power BI Data Flows only does ETL with reporting as the end goal in mind and not for other purposes like writing back updates to source databases or producing flat-file output. But then again, many SQL DBAs would also argue (more strongly) that SSIS packages are fiddly nuisances that are a faff to deploy and should be stored procedures anyway.
SSRS – this concept of a Power BI report as a like-for-like, more modern replacement for an SSRS report is so obvious it barely needs explaining.
But if you're still unconvinced, SSRS lets you build reports showing raw or aggregated stats from a SQL database in table or chart form, and then publish them to a reporting server within an organisation from which business users can view the reports anytime they like, and guarantee that they'll be seeing the latest version of the data. You can also set email subscriptions to prompt them to look at the new data for that morning, and build behind-the-scenes drill-through pages that show a user more detailed data about a certain category when he/she clicks on the row for it.
Power BI does all of the above, except the reports load faster, they don't take absolutely ages to build, the range of available visuals is broader and more stylish, and a user can do cool stuff like type "how many bikes sold by marketing channel 2016" and a graph showing the answer will make itself.
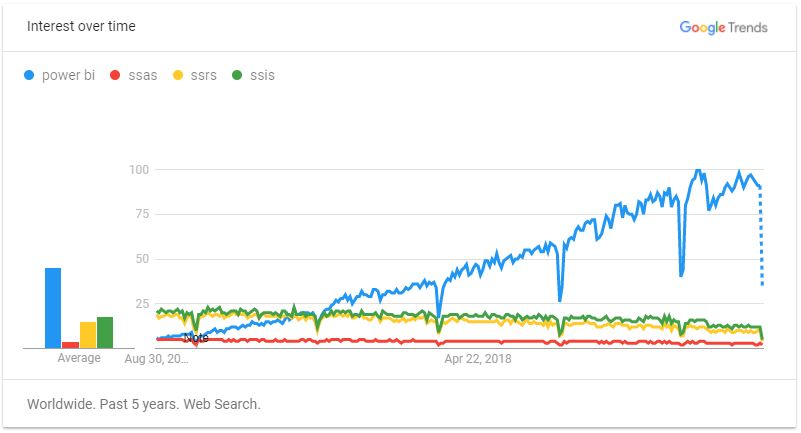
Look at Figure 1 of the Google Trends data below and see how searches for Power BI start to outstrip SSAS,SSIS and SSRS put together some time around January 2018. The writing has been on the wall for nearly 3 years – as obvious as a fluorescent-yellow 32pt Segoe Bold heading against a black background on a Power BI report.
Microsoft will (if not already) slowly wind-down investment and new releases of the SSDT softwares and make Power BI the all-encompassing data super-department of the future. This will provide the toolkit for all core disciplines one associates with business data in a more integrated and harmonised way than ever. In fact it might give the modern business scant need to look anywhere beyond Microsoft for data and IT as a whole, more of which in the next post.
Google Trends searches for Power BI vs SSAS, SSIS, SSRS (last 5 years)
⌚ Back to Latest Post